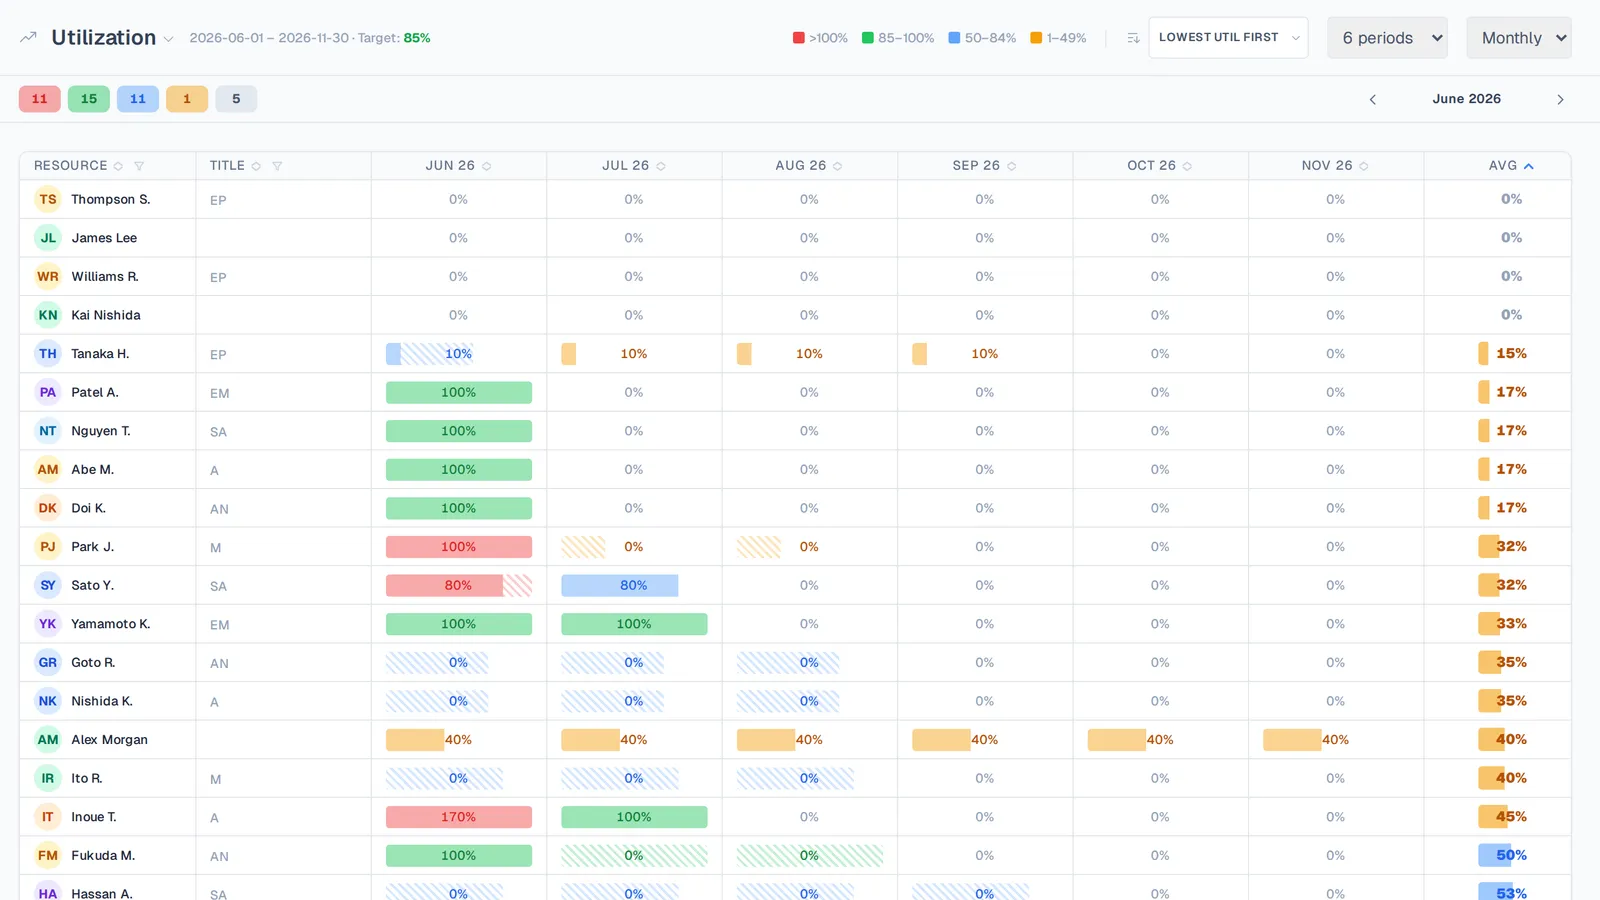
Utilization by person and period, colour-coded against your target.
The numbers, in real time
Measured against your target
On target, under-utilized, over-allocated, or on the bench — colour-coded against a target you set.
Slice it any way
Pivot by person, role, or period — monthly, quarterly, or a custom window.
Drill into any cell
Hover to see a person's per-project split and exactly how much capacity is left.
Always current
Numbers move the moment someone is staffed — no month-end spreadsheet crunch.
Measured against your target
Set the utilization target your firm runs to, and every person and team is scored against it — on target, under, over, or on the bench — in colour you can read across the room.
- Your target, not a generic benchmark
- Pivot by person, role, or period
- Monthly, quarterly, or custom windows
Utilization heatmap
[placeholder]From headline to detail
Start at the firm-wide number and drill into any cell to see a person's per-project split and remaining capacity — the same data that drives the staffing matrix, so the two never disagree.
- Drill into any cell for the breakdown
- Always current as staffing changes
- One source of truth with the matrix
Drill-down
[placeholder]See it on your own projects.
Start free, or book a guided walkthrough on your own data.